2023 Market Summary
“Market Narratives”
January 31, 2024
2023 was a surprisingly great year for the equity markets. Following a challenging investing environment from the year prior, stocks as measured by the S&P 500 Index ignored the dour forecasts of Wall Street’s equity strategists and rose over 24% in price. Much of the S&P 500’s rise during 2023 was driven by a small number of stocks (seven) perceived to dominate the next major wave of technological advancement, artificial intelligence (AI).
More than 15% of the S&P’s rise came in the last two months of the year as investors adopted the market narrative that the Federal Reserve has finally brought inflation down to a trajectory that meets their long-stated target of 2%. With the assumption inflation is under control, the Fed’s policy rate is at or near its peak. More so, the U.S. economy will avoid a recession – or if not – any recession will be quite mild. At its mid-December meeting, Fed Chair Jerome Powell indicated the worst is clearly over. By year end, markets were pricing in six interest rate cuts by the Fed for calendar year 2024.
Poor market breadth continues:
The “Magnificent Seven”, led by chip design company Nvidia, contributed nearly 70% of the returns for the five hundred company index.

AI, a technological process that has existed for decades, captured the equity market’s attention as the Magnificent Seven grew to nearly 30% of the total market capitalization of the S&P 500. From a broader perspective, the Magnificent Seven is worth more than four times the entire Russell 2000 Equity Index.

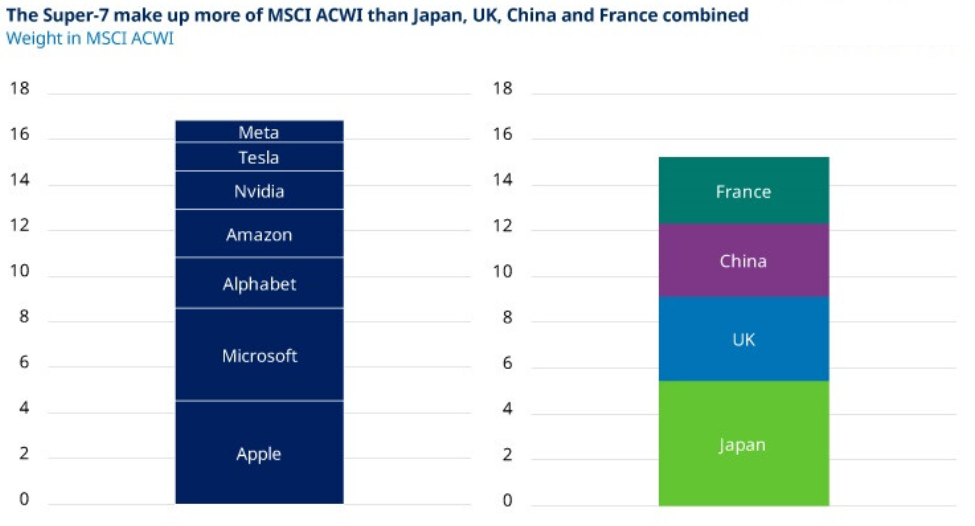
The attraction of AI related equities is not limited to domestic markets. These seven companies comprise nearly 20% of the MSCI ACWI (All Country World Index). As a group, they are larger in market capitalization than any one country’s equity market, outside of the U.S. In essence, the Magnificent Seven has become the “market”.
A round trip for the S&P 500:
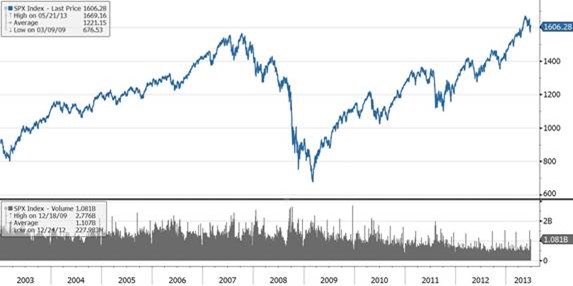
2023’s strong equity returns merely brought the U.S. market back to their all-time highs of December 2021 – a full round trip in stock prices over the course of 24 months. The majority of the advancement was driven by the expansion of the earnings multiple – the increase of the Index’s price/earnings (P/E) ratio. For the S&P 500, the ratio widened as its price (shown below in blue) rose while its underlying earnings (shown in black) declined. To the inevitable detriment of future forward returns, equities are at all-time highs in price while their earnings are deteriorating. Per FactSet, consensus earnings projections for Q4 2023 are anticipated to be down -6% and are expected to fall further by -1% to -2% for calendar year 2024.

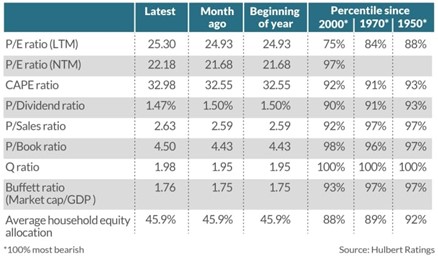
Market narratives aside, it is difficult to argue the broad equity market is attractively valued. The P/E ratio is one relative measure of value. It is used like a navigational compass, providing direction. Below, we share several valuation metrics, along with the P/E ratio, to compare market cycles dating back to the mid-1990s. From a historical perspective, current valuation metrics indicate the domestic equity market is likely near this cycle’s peak.

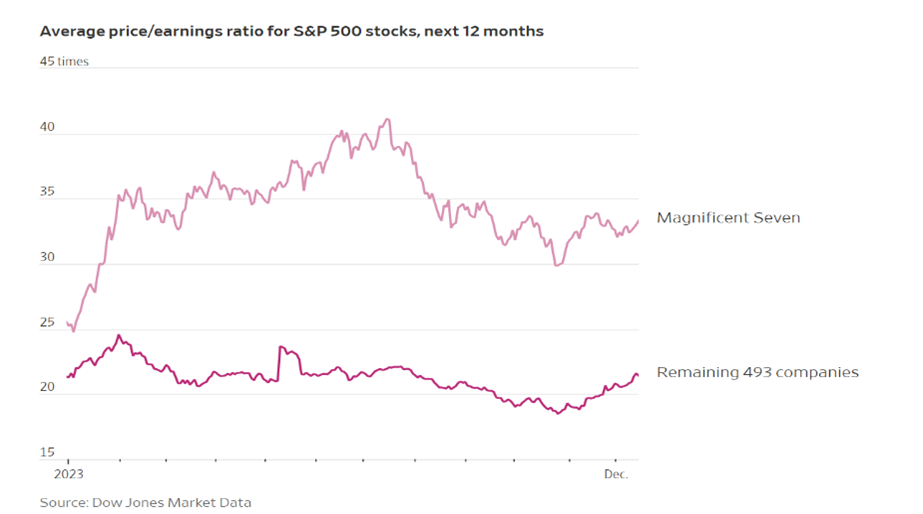
Given their dominance in the S&P 500 Index, it is instructive to segment the market multiples of the Magnificent Seven from the remaining 493 companies. The Magnificent Seven trade at a forward market multiple of over 33 times earnings. The remaining 493 entities in the composite trade at a forward multiple of 22 times. For comparison, the 5-year average forward P/E multiple is 18.9 times earnings, and the 10-year average is 17.6 times. Note that interest rates were near 0% for the majority of both time periods.
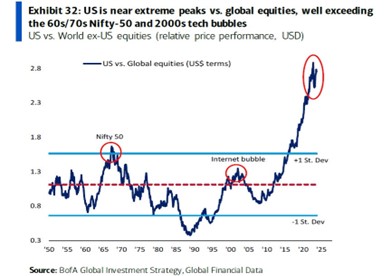
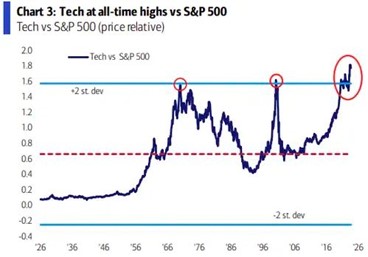
Market sentiment follows price and consequently enormous amounts of capital have gravitated to the popular U.S. equity indices. Comparing the relative price performance of the U.S. market to its international peers reveals that the U.S. stock markets are trading at nearly three standard deviations above average going back to the 1950s. Currently, this metric is higher than what occurred during the “Nifty Fifty” market of the early 1970s or the “Internet Bubble” of 1999-2000.
The large amount of capital flowing into the U.S. has created investment opportunities in non-domestic securities. On a P/E basis, international equities, ex-U.S., are trading at two standard deviations below their U.S. counterparts. At Sterling, we own a growing list of attractively valued foreign securities that include aerospace, infrastructure, and railroad entities.

An ignored narrative:
Rarely mentioned, yet probable based on past equity market cycles, the modest decline in 2022 of 20% may have been a precursor to a more dramatic drawdown. Led by: stubbornly high levels of inflation, high relative interest rates, excessive levels of government debt, alongside a clear shift in monetary policy, the capital market excesses developed from more than a decade of artificially low interest rates were unlikely eradicated by such a modest decline in stock prices.
Analyzing past market cycles is instructive in developing a risk management framework. The chart below highlights nine fundamental valuation metrics that describe the current status of the S&P 500 Index. The three columns on the far right outline each metric’s statistical percentile in terms of past time frames. Higher percentages are indicative of increasing degrees of overvaluation. 100% is the maximum. Current market data shows investors have an extremely large allocation of capital in the popular Exchange Traded Funds (ETFs) such as SPY (S&P 500) and QQQ (Nasdaq 100 Index). Equity holders need to be wary of the possibility that the growth dynamics of the technology companies that dominate both ETFs begin to slow.
Notably, the peak to trough changes in price for the last two full market cycles were both significantly more than the 20% we have witnessed thus far in this one. During the Dot.Com Bubble of 1999-2000, from peak to trough the S&P 500 lost over 48% of its value. The S&P 500 reached a P/E ratio of 30 times earnings, and from its peak price in 2000 it took nearly eight years for the Index to return to its previous high price level.

During the Great Financial Crisis, at its top the S&P 500 was trading at a P/E of nearly 24 times earnings. Similar to the Dot.Com period, it was nearly seven years before the popular benchmark returned to its previous highs. The S&P 500 declined over 56% from the top of the cycle to the bottom.
The dominance of the technology sector during previous market cycles reveals a concerning relationship between technology shares and the overall S&P 500 Index. Below is a chart of past price peaks dating back to the Nifty Fifty period of the early 1970s.
 The economic environment:
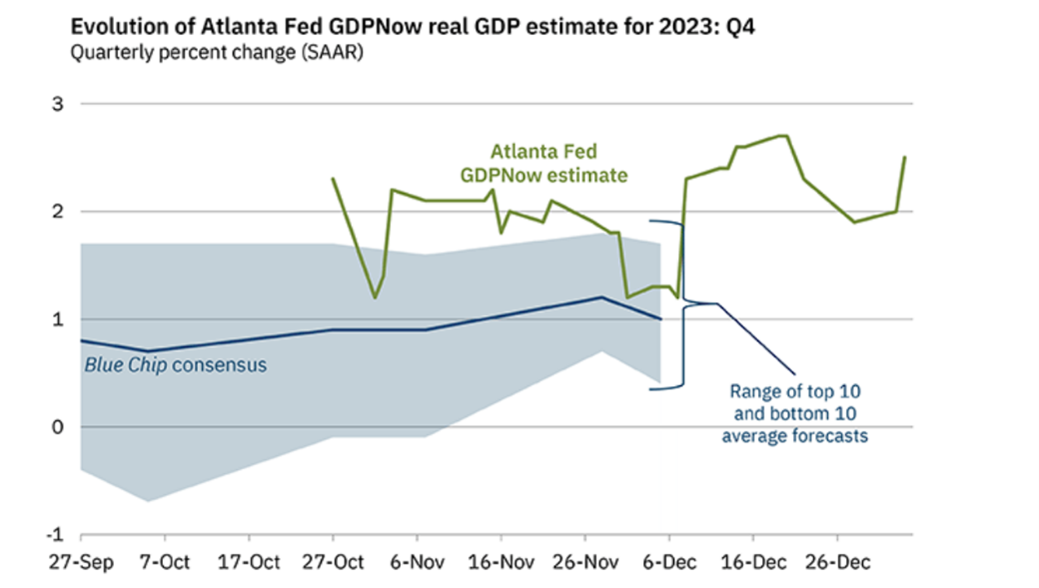
The U.S. equity markets are pricing an economic outlook of positive and steady growth with a large amount of recent economic data supporting that viewpoint. Consumer spending drives nearly 70% of U.S. GDP and retail sales data has been steadily positive on a month to month basis for the most of 2023. The labor market has remained strong with the unemployment rate still hovering near historic lows. In addition, the most recent economic forecast from the Atlanta Fed suggests the economy is growing by 2.5% as we entered the new year.
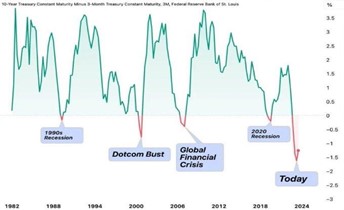
While the equity markets are sanguine regarding the health of the economy, the fixed income markets are clearly not. One reliable indicator of future economic growth is the shape and structure of the U.S. government yield curve. For the past 15 months, the yield curve has been inverted – defined as short-term interest rates, 1 to 6 month U.S. Treasury paper, having higher yields than those of longer dated maturities such as 5-year and 10-year bonds.

As an economic indicator, inverted yield curves have preceded the last four recessions. This economic metric has given only one false signal in the last seventy years.
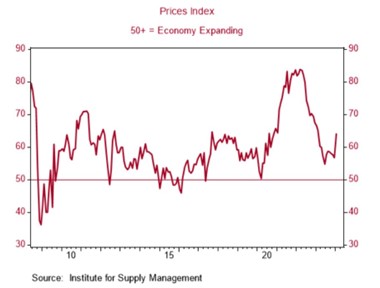
Not surprisingly, the economic data is mixed. For as many supporting positive data points, there are an equal amount of offsetting stagnant or declining economic outlooks. Rarely reported is the growing number of U.S. bankruptcy filings. Last year, bankruptcies posted their largest number since 2010. The Conference Board’s Leading Economic Index (LEI) has posted twenty straight monthly declines. The Institute for Supply Management (ISM) recently reported that only 5.6% of purchasing managers are experiencing growth in their businesses. In general, the time lag between the Fed’s initial interest rate increase and its impact on the economy is 18 to 24 months. The Fed initiated its first rate increase 21 months ago, in March 2022.

A less popular but more likely narrative:
Inflation is far from quelled. Under the surface, a myriad of variables will keep inflation levels elevated and possibly lead to a resurgence in price pressures. Given the massive amounts of fiscal and monetary stimulus lingering in the economic system, rising wage and service sector costs, along with periodic energy and food supply disruptions, it is certainly conceivable that cost pressures will be higher than most anticipate. Further, current inflation expectations do not appear to factor in the risks associated with increasing levels of geopolitical strife.
In terms of data, the Core Personal Consumption Expenditures (PCE) price index is one of the Fed’s favorite inflation statistics. A review of this price series over the past 15 years indicates the degree price levels have risen from the Fed’s 2% inflation target.

Wages, the largest expense component for most businesses, have risen steadily over the past couple of years. It is likely wage inflation will be ingrained in the economic system as compensation levels continue to rise and unemployment rates and job cuts remain low. As shown below, the Atlanta Fed’s wage growth tracker highlights the increases of the past few years.

The service sector comprises nearly 80% of the nation’s GDP. The prices paid component of the ISM Services PMI recently spiked to 64 vs. 56.7 from the month prior. A month-to-month increase last witnessed in 2012.
The unfortunate reality for all of us is the long term impact of steadily rising prices. From 2020, the cumulative rise in inflation has increased overall costs by approximately 20%. While wages are on the rise, average hourly earnings have gone up only 14% leaving most struggling to make ends meet. Said differently, the nation’s purchasing power has declined by nearly 20% during the past four years. This is not the dynamic of a healthy economy.
![]()
The Opportunity Set for 2024 – “this time is different”:
Regardless of the degree of economic growth, or decline, the key variable dictating investment performance for 2024 and beyond will be capital management strategies that incorporate higher interest rates than those of the recent past.
For over a decade, interest rates were maintained at historic lows predicated upon global central bank’s policies such as ZIRP (zero interest rate policy) and NIRP (negative interest rate policy). Artificially low interest rates incentivized investors to assume a large amount of risk which led to a wide assortment of capital misallocation. Asset values, which were once deemed attractive at extremely low levels of interest rates, are no longer as valuable. With market valuations near historically high levels and the cost of capital no longer priced at the zero bound, the current investment environment is quite different from the period that drove domestic equity indices to all-time highs. Those hopeful for a continuance of multiple expansion in the domestic equity indices will likely be disappointed.
We believe the defining characteristic for return generation will be owning equity securities whose returns on invested capital (ROIC) exceeds its cost. Our core equity positions have the following characteristics: a global reach, participate in monopolistic or oligopolistic markets, have high customer switching costs, possess pricing power, and have strong balance sheets.
Fixed income portfolios will require the flexibility to adjust to the changing dynamics of global yield curves. Interest rate spread analysis, duration profiles, and credit quality characteristics will all be essential given the volatility in bond markets.
In terms of portfolio risk management considerations, fundamental valuation parameters suggest investors maintain a focus upon absolute returns. As highlighted, there are a number of financial and economic variables indicating the risks associated with capital assets are much higher than their anticipated returns.
All the best,
John H. Payne, CFA
Managing Partner
Chief Investment Officer
Arumayta M. Arguello, CFA
Partner
Portfolio Manager
Comments are closed.


