2022 Year in Review:
“The Era of Free Money is Over”
January 23, 2023
The bubble is unraveling:
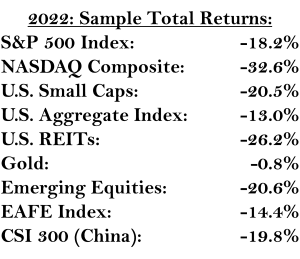
The financial market storm we have long anticipated arrived with a vengeance just as the calendar turned the page to 2022. In dollar terms, last year had the greatest loss of capital in history as global stocks and bonds lost over $37 trillion in market value. For the benchmark indices, 2022 was one of the worst ever on a twelve-month calendar basis as depicted by the returns of several major asset classes listed below:
The speculative bubble is unraveling – the era of free money is over. Driven by years of manipulating interest rates to historic lows, amplified by unprecedented levels of global monetary and fiscal stimulus both before and post Covid, we are experiencing the highest inflation rates in over forty years. Investors must now navigate an environment most have never seen – rising and elevated interest rates coinciding with diminishing monetary liquidity occurring as global economies are in decline.
Inflation will remain persistent – well above the Federal Reserve’s 2% target:
Entering the new year, we believe the defining characteristics dictating asset returns will be the level of inflation rates and the subsequent policy responses of the globe’s central banks. Today, the “market consensus” in the U.S. is: one, inflation peaked in June of 2022 at 9.1% (measured by the year-over-year CPI); two, inflation is quickly receding; three, the Federal Reserve Bank will hike its policy rate, Fed Funds, modestly by 25 basis points once, or at most two more times: and finally, the Fed will begin to cut the Fed Funds rate before the end of this year. This describes the popular “pivot” scenario which has driven asset prices higher from the recent lows of last October.
We think the confidence displayed by the markets that inflation rates will drop substantially in the near future to the Fed’s stated 2% target is misplaced. From merely a data perspective, the level of inflation will remain persistent and well above the Fed’s 2% target based on several prominent variables: wages, service sector inflation, energy prices, deglobalization, and the reopening of China.
The Fed has stated wage growth and the tight labor market is the key area of focus in their efforts to rein in inflation. The chart below highlights the rapid growth in wage rates for both low skilled and high skilled workers. As shown, low skilled employees are seeing their wages grow the fastest of the two. Once workers receive increases in their pay scales, it is very difficult for businesses to reverse them. Importantly, for the average business, compensation and benefits make up nearly two-thirds of total expenses. Rising costs that are passed on to their customers.
Most broad inflation indices have been on the decline. Analyzing the internal components of the general inflation statistics reveal a large subset of those measures will likely remain elevated. The chart below dissects the PCE (Personal Consumption Expenditures) Index into three parts: Core PCE inflation (blue line), Core PCE “goods” inflation (gold line), and Core PCE “services” inflation (red line). The PCE Index is another of the Fed’s favorite inflation gauges and excludes food and energy costs.

The Core PCE goods inflation, consisting of items such as lumber and furniture, has decidedly turned lower. Core PCE services inflation contains health care, housing, and professional services. Presently, the service inflation component has stabilized, and there is no indication these expense categories are weakening.
Energy prices affect virtually every aspect of the global economy. Oil prices are historically volatile but have recently remained in a range between $75 to $105 per barrel. Energy prices follow classic economic demand and supply curve dynamics. In this case, higher demand relative to supply will keep prices elevated, all things the same.
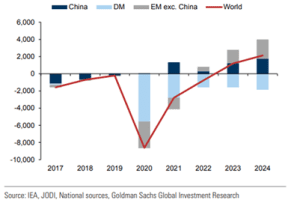
Post the Covid period, global demand has been steadily rising. As China reopens its economy the trajectory of the demand curve will continue to rise. The following chart shows past changes and future expectations of oil demand for the major economic regions of the world:
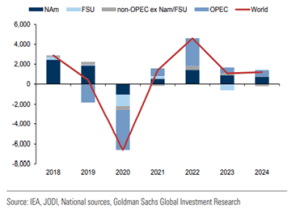
On the supply side, global spare capacity remains near historical lows. OPEC has been cutting production and in the U.S. the shale oil industry is maturing. Russian production has been growing to finance their war with Ukraine, but their overall output will be curtailed by the embargo imposed by many countries. For the next couple of years, it appears the global supply curve will remain flat.
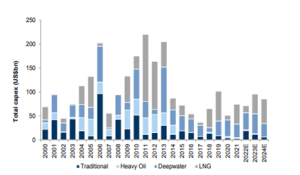
The fossil fuel industry also must navigate a political facet as well as an economic one. Over the past decade, the energy industry has come under direct attack by political leaders of the Western developed countries. Threatening hydrocarbon producers with extinction does not incentivize the industry to invest in long-term exploration and development projects. As highlighted below, the fossil fuel complex began to significantly reduce its capital expenditures in production facilities in 2014.
The long-term implications are not minimal. Hydrocarbons generate 85% of the key components that power the globe’s economies.
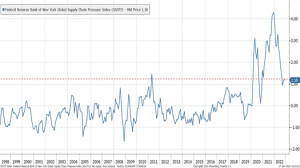
For decades, the globalization of the world’s economies and supply chains has been a significant influence in keeping costs, and hence overall inflation levels low. “Just in time” inventory management was a pillar of corporate management processes as the ability to easily source key components from anywhere in the world allowed manufacturers to minimize their cost structures. Fissures within the global supply chains began in earnest during the Covid recession and have materially increased as countries have become aware some trading partners may not share their economic interests. The pendulum has now swung to deglobalization, and subsequently overall costs are now higher. The Federal Reserve Bank of New York monitors supply chain pressures. Businesses will adjust, but the deflationary benefits of globalization have ended.
Finally, another element of the inflation matrix which will add to cost pressures is the reopening of China’s economy after years of ongoing lockdowns. Earlier, we pointed out the “goods” component of the PCE Index had been falling. Commodity prices have rebounded recently as highlighted by the CRB’s raw materials index and will be an additional variable for the Fed to monitor.

Central banks will continue their inflation fight:
High wages and a tight labor market, stubborn service sector inflation, high energy prices, deglobalization, and a surge in demand from China are several reasons core levels of inflation will remain persistently elevated. Unless domestic and global economies fall into a severe recession, it is highly probable the Fed and global central banks will remain quite vigilant in their focus on inflation – a fact not priced into today’s securities prices. Global inflation rates remain high and materially above a 2% target inflation level.
In response, virtually every central bank has continued to consistently raise interest rates. The matrix of columns below shares a more comprehensive view of current global central bank monetary policies and their respective levels of inflation.
The column “Rate” defines each country’s policy rate. The column “Central Bank Rate” shows the current level of each country’s policy rate, and the column “CPI YoY” details recent inflation levels.
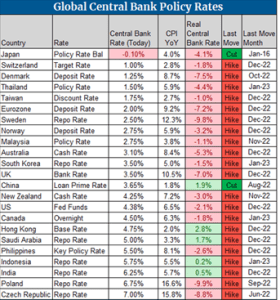
The important measure is the column “Real Central Bank Rate” which is the difference between the current policy rate and the existing inflation rate. In sections that are highlighted in pink, the real inflation rates are negative, the CPI rate being greater than the policy rate. Economic history suggests inflation levels will not be contained, nor arrested in periods of negative real inflation rates. Itemized in the column “Last Move”, most countries have a long way to go and investors should expect to see policy rates continue to increase.
Higher for longer:
The Federal Reserve Bank has two jobs: keep inflation low and maximize the number of people that are employed. The Fed is completely embarrassed by their past policies and public statements. Despite compelling evidence to the contrary, the central bank continued to profess for some time inflation was “transitory”. It should now be clear to all the Fed does not have any ability to forecast inflation, nor understand its dynamics. It is also evident the credibility of the Fed is questioned both at home and on the global stage.
The Fed has been quite public in stating their intent to keep inflation under control and made every effort to communicate to the markets its approach to interest rate policy is one of “higher for longer”, not the “pivot” scenario that is now prevalent.
The “higher for longer” refrain from the Fed inherently references the approach taken by former Fed Chair Paul Volcker to quell high inflation when rates skyrocketed in the 1970’s and early 1980’s. For reference, the chart below shows the then CPI levels (blue line) and the corresponding Fed’s policy rate, Fed Funds (black line). As noted, inflation rose quickly rising to over 12% by the end of 1974. Given those increases, the Fed Chair at that time, Arthur Burns, embarked on a series of Fed Funds rate hikes. Mr. Burns, confident that inflation would fall as the economy weakened in 1973, then began a series of interest rate cuts to soften the decline in the nation’s economy. Shortly thereafter, the economy recovered, as did inflation. The key issue was underlying inflation expectations were not alleviated and the CPI rose steadily over the next couple of years to peak at nearly 15% in 1980.
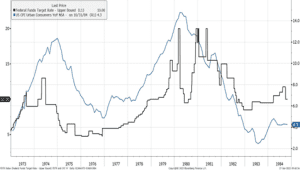
This chart has been prominent in every meeting of the Federal Reserve during the past year and provides the background, and fear, for the Fed’s “higher for longer” narrative.
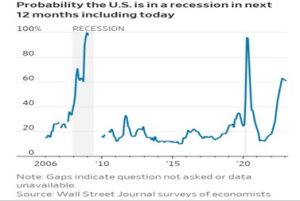
One direct outcome as central banks continue to raise interest rates is economic growth will continue to slow. Slowing economies will rein in most price increases. One outcome of past hiking cycles is the onset of economic recessions. A recent survey by the Wall Street Journal of economists details their perspectives that the probabilities of a U.S. recession is growing, now at a 60% probability. Whether or not the U.S. will soon fall into a recession or not, it is clear several critical components of our economy are slowing.
Opportunity Set for Q1 2023:
One of the more worthless endeavors undertaken at the beginning of each year are the annual market forecasts presented by virtually every Wall Street investment firm. Each year, the expectations of the “pros” are for positive outcomes, typically a return of approximately +10%. For the record, most of Wall Street’s market strategists missed 2022’s returns by an average of nearly -30%.
In terms of developing investment strategies, market forecasts provide little value, including our own. We focus on factors in which we have a very high level of conviction. Currently there are two:
- The Fed and global central banks will continue to raise interest rates
- Consensus earnings expectations for the U.S. equity market are too high
We share a greater perspective of a sample of opportunities these distinct variables will dictate for future returns in the Appendix. Broadly, we believe there is demonstrated value in the short end of the fixed income yield curve, attractive opportunities throughout the capital structure in the energy sector, and global and domestic equities with strong balance sheets and pricing power.
There are several attractive securities given past market drawdowns. It is important to emphasize most market indices remain vulnerable in an environment of rising interest rates and declining earnings power. Given the sheer scope of market speculation prior to the end of 2021, it appears likely there is more downside risk inherent in the markets than investors recognize.
All the best,
John H. Payne, CFA
Managing Partner
Chief Investment Officer
Arumayta M. Arguello, CFA
Partner
Portfolio Manager
Appendix:
Investment opportunities – Q1 2023:
- Overweight short-term, high quality fixed income securities.
- Barbell positions; largest allocations of capital in the two-to-three-year maturity range.
- Allocate smaller positioning in securities in the five-to-seven-year maturity range.
Thesis: Given the Fed’s resolve to lower inflation, we think it very likely the central bank will continue to increase the Fed Funds rate. Regardless of the final target for Fed Funds, the Fed will keep rates elevated for some time. While Mr. Powell remains the Fed Chair, he will be adamant in his desire to repair his reputation.

Fixed income current yields, represented by the U.S. Treasury yield curve are dramatically above the Fed’s 2% inflation target. Generating low risk income at levels above 4% is particularly attractive given the current economic backdrop. Investors are being well compensated to wait for additional opportunities.
- The equity markets:
Current valuations and higher interest rates are not market friendly environments. Despite the near 20% decline in the S&P 500 Index, the valuation of the Index remains higher than at any time except the peak valuations of the Great Depression of 1929 and that of the Dot-Com bubble of 1999-2000.
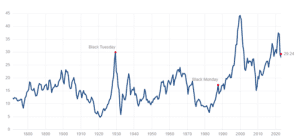
The chart above highlights the Shiller P/E, a ratio calculated by the current price of the S&P 500 index divided by its inflation-adjusted, 10-year average of earnings. The current P/E is 29.24 times as of January 13th. The equity market’s decline during 2022 was driven by the multiple of the P/E contracting. Price to earnings ratios contract in direct correlation to rising interest rates. A factor that has not been priced into most equities is a contraction in their future earnings. Overall earnings expectations have declined slightly, albeit remain higher in comparison to last year.
Should corporate earnings fail to meet analyst’s optimistic expectations, as we anticipate, a large number of stocks will be vulnerable to another wave of drawdowns.
The near-term outlook for earnings will be a key driver for equity prices over the next couple of quarters. Over a longer time horizon, investors should consider there is a reasonable probability equity returns as measured by the broad market indices may be quite muted for an extended period of time.
Forward equity returns are dictated by two key variables: current asset valuations and the levels and trajectories of interest rates. We share two relatively recent time periods, each lasting well over a decade, where equity total returns provided no capital appreciation. Returns were essentially 0%.
Starting from lofty valuations, we provide a long-term chart of the twelve years beginning from the Dot-Com bubble’s market cycle top, 1999-2000. The S&P 500 Index is shown in blue. The P/E ratio of the S&P 500 Index is highlighted in green. In 2000, the P/E ratio was essentially 30 times earnings and the S&P 500 traded at approximately 1500. The S&P did not consistently exceed the 1500 mark until late 2012.
From a starting point of extreme valuation it is optimistic to expect index returns, or individual equities to generate attractive returns.

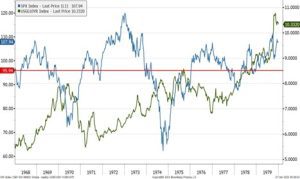
The level and trajectory of interest rates have a strong influence on asset prices. Simply put, interest rates act as an anchor to asset returns. A market cycle to consider the effects of interest rates occurred during the period from 1968 to 1980. The S&P 500 Index, in blue in the chart below, ended at nearly the same price level in 1980 as it was in 1968. The driver of such a poor outcome for stock market returns was rising levels of interest rates here shown by the trajectory of yields of the U.S. Treasury 10 Year Note. It is important to note that despite corporate earnings rising meaningfully during this time frame, interest rates played the dominant role in suppressing prices.
In both market cycles, the overall index returns were unappealing. The notable aspect in both periods is the significant volatility that existed during each cycle. There were many investment opportunities available for those with an active management approach.
In periods of high relative valuations such as those that existed at the peak of the Dot-Com era, risk management and fundamental security selection provided multiple prospects to enhance returns. Similar to the current investment cycle, rising inflation drove interest rates higher in the 1968 to 1980 period. Hard assets such as real estate, raw materials, energy, and gold performed quite well during that time.
Today’s market environment shares characteristics of both prior periods. A year ago, short-term fixed income paper had yields of below 1%. Now, investors can capture yields above 4% with very little risk. The current elevated interest rate environment will prove detrimental to most equity securities. Equity investments that possess strong competitive advantages, have strong balance sheets, and enjoy inherent pricing power to counter rising cost pressures will prosper over time.
We view risk as the permanent loss of capital, not the academic measure of price volatility. During the market drawdowns, we have invested in several attractively priced securities in a wide range of industries. We expect many more opportunities to unfold as the year progresses.
Comments are closed.


