2021 Year in Review:
“A Material Mispricing of Risk”
January 13, 2022
“The beat goes on….”
2021 marked the twelfth year in the past thirteen that the U.S. equity market had a positive return. As the year ended, stock prices as measured by the S&P 500 Index continued to reach all-time highs on a near daily basis. The catalyst for the S&P 500’s more than 100% total return from the lows of March 23, 2020 has been the dual combination of the largest fiscal and monetary stimulus packages in history. These government policies have created a three-step economic cocktail. First, fiscal policies have directed trillions of dollars into consumer’s pockets. Second, central banking strategies have manipulated the most important price in economics, interest rates. And third, our central bank has elevated financial markets by their direct purchases of U.S Treasury bonds, mortgage securities, and corporate bonds and stocks. After nearly twenty months of ongoing governmental interventions, equity valuations have never been higher and yields on fixed income securities are near record lows.
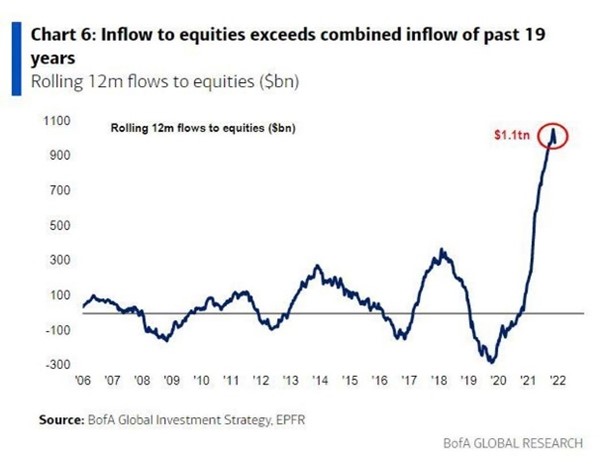
Risk management principles have historically been a proven strategy to both grow and maintain capital. Albeit not a consideration today, but one would think the combination of all-time high equity valuations in conjunction with all-time lows in future forward returns would warrant a rise in the levels of caution within the investment community. There is very little evidence investors are reducing risk exposures by either lowering allocations of their equity positions, or hedging their portfolio’s overall risk to a potential market drawdown. Despite an environment of historically high valuation metrics, equity investors are allocating even greater and greater amounts of capital to stocks. Also, the relative percentage of capital hedged to protect capital in the event of a market decline is as low as it was during the dot.com period. The charts below highlight the level of market complacency shared among most of today’s investors.

For the short term, market valuations reflect investor’s psychology:
Over short time horizons asset valuations reflect market psychology. Rising prices embolden investor’s behavior and the current market cycle is very reminiscent of market cycle peaks of the past. Today’s market perceptions have been conveniently distilled into popular acronyms: TINA (there is no alternative), FOMO (fear of missing out), and YOLO (you only live once). These perspectives have helped steer massive amounts of capital into a wide range of novel investments such as “meme stocks” (equities with popularity on social media platforms), crypto currency offerings, as well as the perception there is no price too high to pay for “disrupter” companies such as electronic vehicles (EVs). Certainly, there are many transformative technologies and innovative businesses being developed which will benefit us all. That said, the scale of capital being drawn to several areas should give one pause given past economic outcomes of similar levels of exuberance.
Meme stock examples are Avis Budget Group (CAR) and AMC Entertainment (AMC). Those who successfully rode the wave of social media support, think Reddit and Robinhood, have been richly rewarded as Avis reaped a 456% return year-to-date. Avis holders pale in comparison to those in AMC – which posted a nearly 1,200% return thus far in 2021. On the left is a year-to-date price chart of Avis. The chart on the right shows AMC (in blue) compared to other meme stocks: GameStop and Sundial Growers.
Avis Budget Group

AMC Entertainment

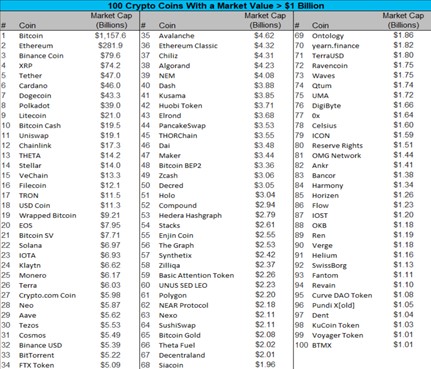
For the most part, crypto currency investors enjoyed an extremely good year as well. There is great debate in the investment community as to the long-term merits of this asset class. One argument offered by crypto currency supporters is the asset is a compelling alternative to fiat money given the massive amounts of global currencies being digitally created by the developed market’s central banks. While it is likely the dominant form of crypto currency has yet to be created, the suggestion that crypto currency is in limited supply is not supported by the data within the marketplace. We offer the following chart to point out that recently there were over 100 different crypto coins sporting a market value of greater than $1 billion.
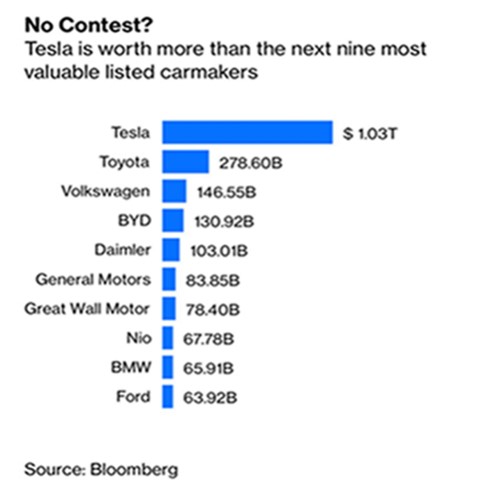
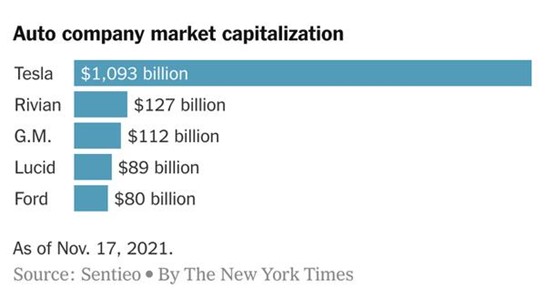
In past writings, we have highlighted both the success as well as the valuation metrics of EV manufacturer Tesla. The company’s vehicles are well crafted and extremely popular. Recently, two new EV entrants, Lucid and Rivian, have come to the public markets. Both offerings have been more than well received. Similar to Tesla, Lucid and Rivian have captured investor’s enthusiasms that focus on the total addressable market for electronic vehicles. Despite the rhetoric exposed by the financial media and research analysts that electronic vehicles are “mobile technology platforms”, in reality these are automobiles and trucks – products produced by a wide range of well establish original equipment manufacturers (OEMs) such as Ford, Toyota, Volkswagen, and General Motors to name a few. For those interested in data, Toyota will soon produce more EVs globally than any other car company. Regardless, Tesla has a market capitalization greater than the next nine largest automobile OEMs combined. Together, Lucid and Rivian have produced all of 600 vehicles – in total. At their recent highs of mid-November, both companies had a greater market capitalization than Ford Motor.
Market risk is significantly underpriced:
Not only did stocks reach all-time highs, but so did real estate, initial public offerings (IPO’s), and special purpose acquisition companies (SPAC’s). In reality, as capital steadily flows into a myriad of asset classes, the overall level of risk is rising as well. We believe financial market risk is meaningfully underpriced by the marketplace. The list of risk variables is long:
- Fundamental valuations for equities remain near or at historical highs for virtually every metric. Today’s market participants are clearly not trading on fundamental characteristics. The history of market cycle peaks suggests valuation analysis will not be acknowledged until after the fact. For reference:


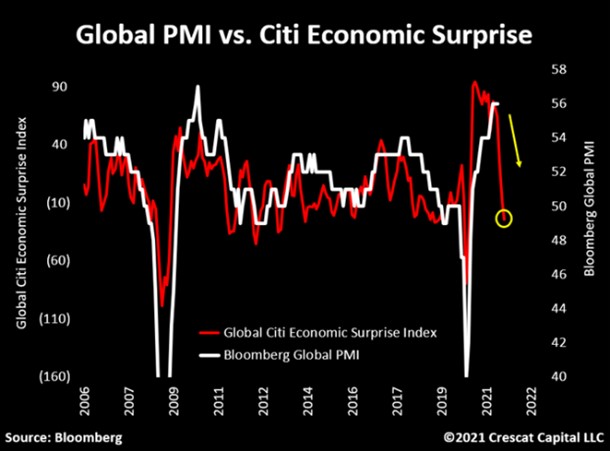
- Despite injecting trillions of dollars into domestic and global economies, GDP growth rates are slowing worldwide. In the U.S., the Atlanta Fed’s GDPNow economic forecast estimate for 2021 GDP growth has now dropped to less than a 2%. Data from Citicorp suggests that economic deceleration is coming from Asia and spreading to the rest of the world.

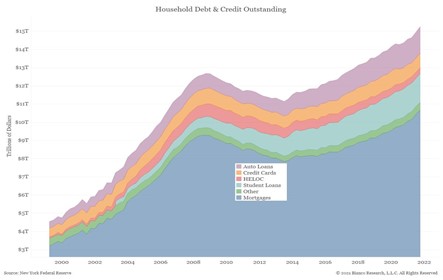
- Debt levels in all sectors of the domestic and global markets are at record levels. Note that consumer spending generates nearly 70% of domestic GDP. As of Q3, U.S. household debt has increased to nearly $15.25 trillion.
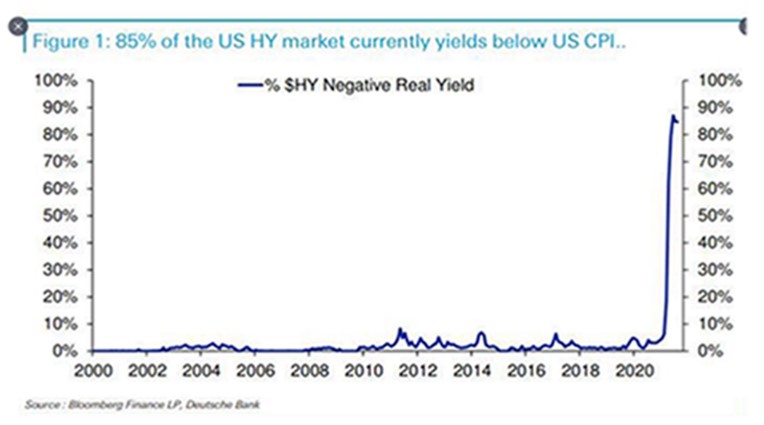
- Virtually every fixed income security trades at a negative “real” yield – the difference between its nominal yield and the rate of inflation. More so, most high yield paper, formerly known as junk bonds, trades at negative real yields as well.
- Market structure – the concentration of algorithmic, quantitative, and passive equity investments driven by “price” comprise nearly 80% of daily trading volumes.
- Political risk – domestically, our political divide hampers long term strategic planning. From a macro perspective, the key levers of our nation’s economy are being driven by the demands of two-year election cycles.
- Globally – international geopolitical risk continues to rise. Supply chain disruptions have led countries to internalize their economic growth strategies to be less reliant on outside suppliers. The reduction in globalization not only increases inflationary trends but at the same time reduces the standard of living for the vast majority.
- >Health concerns – as multiple variants of the Covid virus spread globally, nations continue to apply unique strategies to protect themselves.
The largest risk to the financial markets – inflation and rising interest rates:
Earlier this year, the Federal Reserve declared their goal was to target a 2% inflation rate. Unfortunately, the current rates of inflation are now three times the Fed’s target rate, and the trajectory of higher cost pressures continue to trend higher. High inflation rates create both economic and political issues for the central bank as well as for the Biden administration – hence the phraseology from our nation’s officials that elevated cost pressures are “transitory”. It remains to be seen if the current rise of inflation is in fact temporary, but a wide range of data does not support the transitory theme. While ignored presently, a consistent rise in interest rates is not a financial market friendly event.
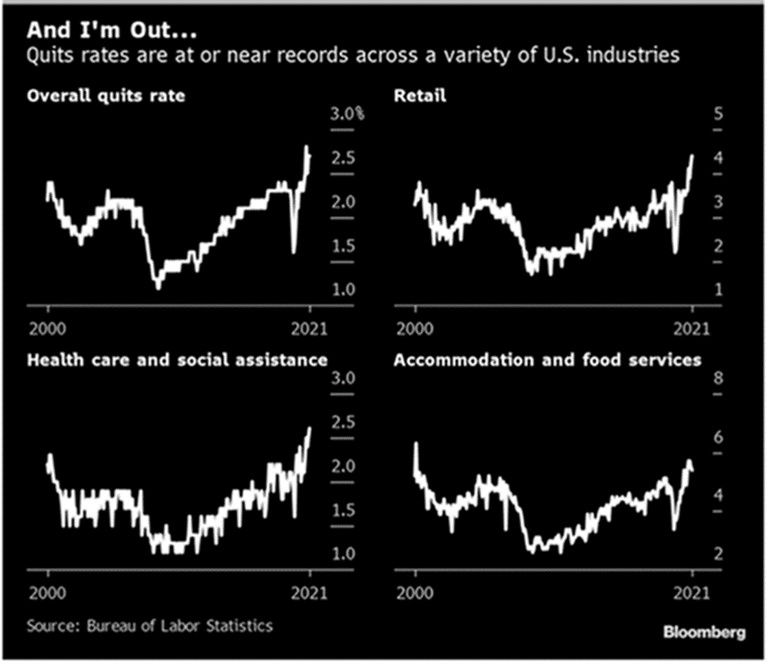
We think it highly likely inflationary forces will remain elevated for an extended period. From a historical perspective, high levels of inflationary episodes are apparent in environments where governments are fiscally imprudent, or when a nation’s money supply grows rapidly. The U.S. has met both characterizations. Certainly, persistent inflation is being demonstrated in more than a few key areas. One example is labor costs. Once wages and salaries are increased, they are very difficult to reverse. Further, many states are instituting laws to increase the minimum wage. One new factor in the labor market is the large percentage of workers that are removing themselves from the work force. Now dubbed “The Great Resignation”, roughly 33 million Americans have quite their jobs since the spring of 2021. The trends are highlighted below:

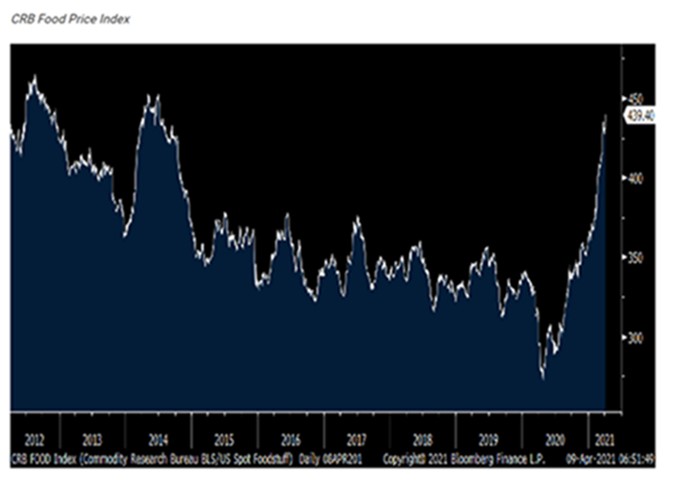
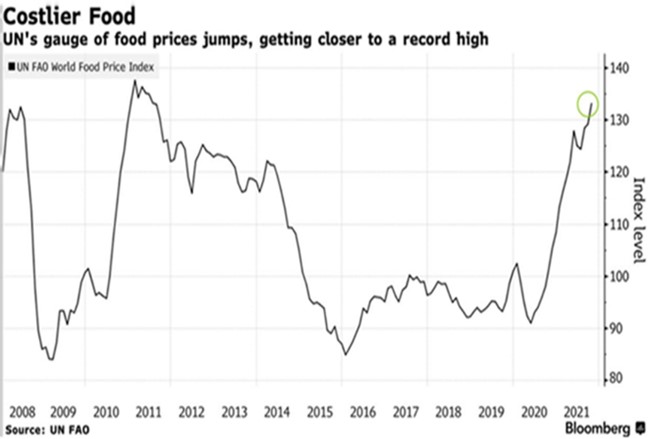
On each trip to the grocery store shoppers find food costs are steadily rising as well. Note below the CRB Food Price Index from 2012, as well as the United Nation’s gauge of food prices:
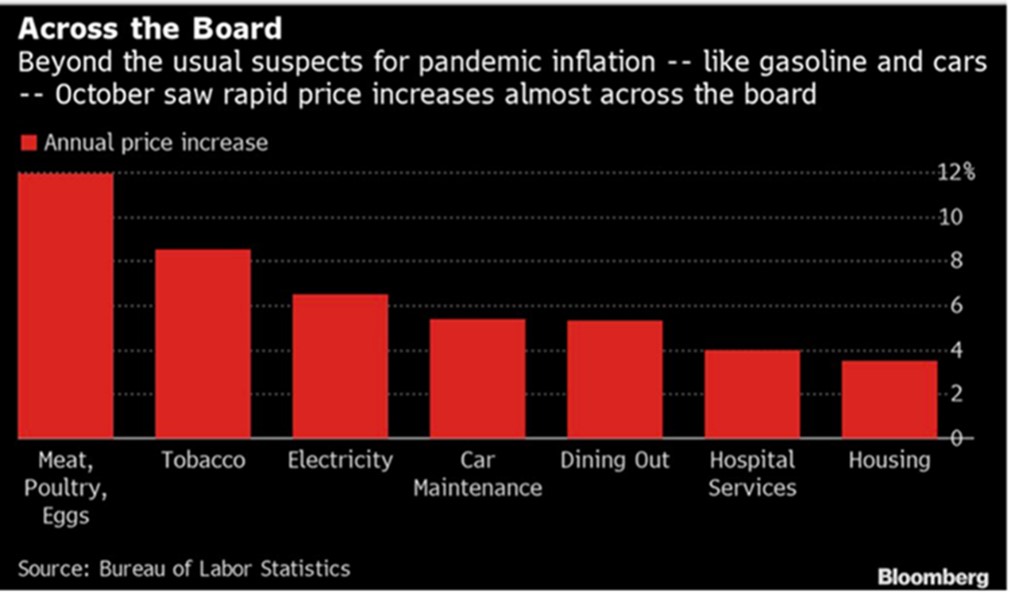
Broadly, price increases have been evident in almost every category:
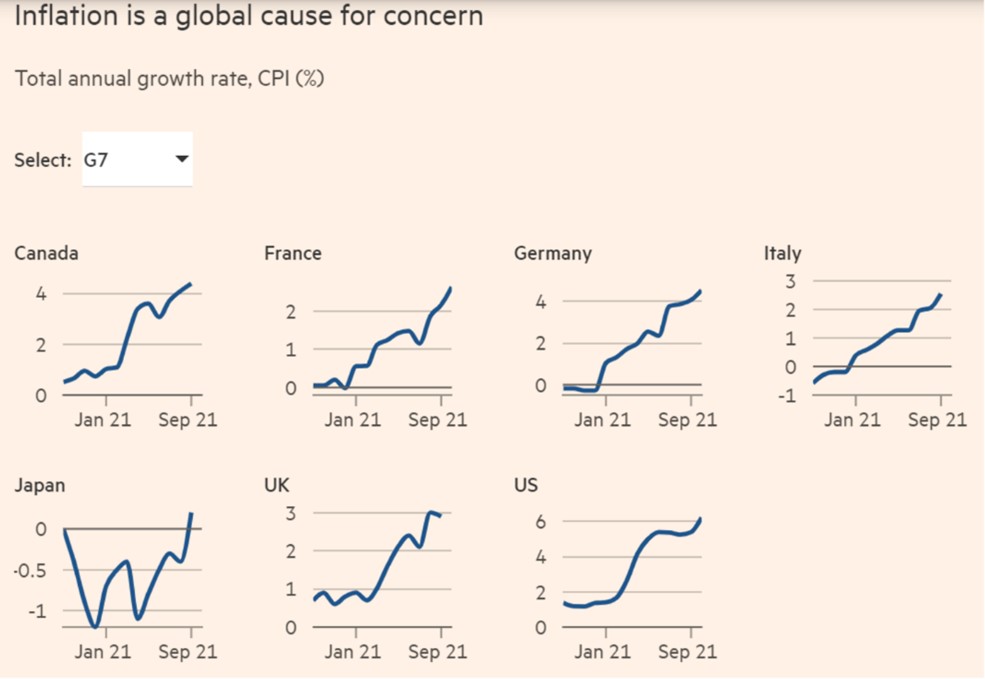
More so, inflation is not only an issue in the U.S. As shown below, annual growth rates of consumer prices are rising globally:
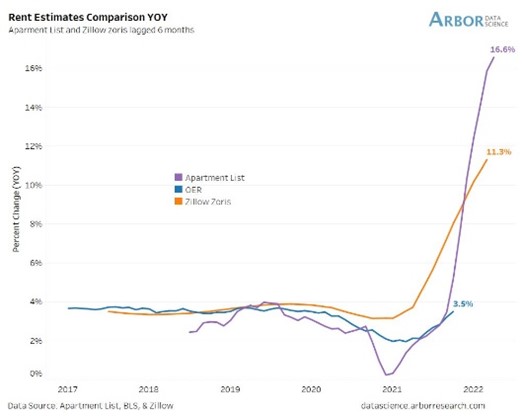
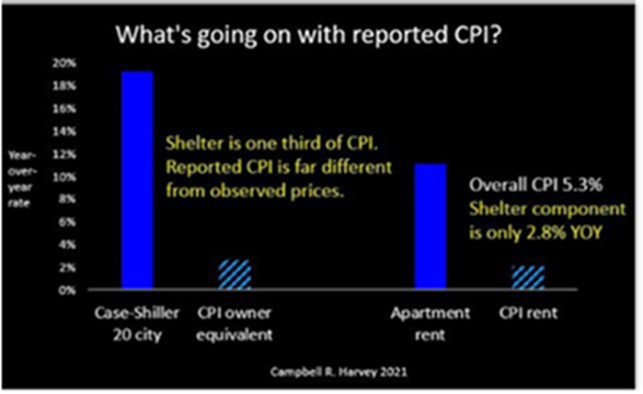
Market commentors are quick to point out today’s inflationary period will not mimic those of the double-digit experiences of the 1965 to 1982 period. While likely true, it is important to understand the methodology the government calculates its inflation data has been significantly altered since that time. The largest modification lies in the calculation for housing expenses. During the 1965-to-1982-time frame, home prices were a direct component of the Consumer Price Index (CPI). In 1983, the commissioner of the Bureau of Labor Statistics (BLS) announced that shelter costs would be converted to a rental equivalence measure, Owner’s Equivalent Rent (OER).
The OER adjustment has a huge impact on the data series. Note that housing costs represents over 30% of the CPI, and OER comprises 75% of the shelter component – indicating it has a 23% weight in the total CPI calculation. For the record, home prices have risen more than 20% year over year, while the OER component has reported a rise of merely 3%. On an apples-to-apples basis, should the housing component reflect the housing expense calculations prior to the 1983 adjustment, December’s CPI of 7.0% would have been increased by 3.9% – signaling at year’s end the CPI “could” have been reported as nearly 11%.
Adding in other adjustments instituted within the CPI calculations such as substitutions, product replacement cycles, and anticipated quality adjustments, one can suggest on a comparative basis today’s inflation rate could be higher than 13%. Said another way, if inflation serves as a tax on capital, then the majority of Americans are experiencing much higher price pressures than those consistently reported in government statistics.
Even with today’s published inflation rates, the Federal Reserve has found themselves in a difficult position. After promising the markets they would not alter their easy money policies for the next couple of years, the “markets” have forced their hands. The Fed recently indicated it will reduce the amount of quantitative easing (QE) purchases from its current monthly $120 billion purchases by $15 billion a month going forward. Reducing asset purchasing is clearly not the same as raising interest rates – a process the Fed will proceed with great trepidation given its last experience in raising interest rates. You may recall Mr. Powell attempted to “normalize” interest rates near the end of 2018 by both reducing the Fed’s balance sheet (fixed income securities were allowed to mature) and modestly increasing interest rates to 2.5%. Global equity markets demonstrated their reliance on liquidity by promptly dropping 20% during 2018’s last quarter. Mr. Powell quickly reversed that decision in early January of 2019.
Short term – market valuations are largely a function of investor psychology. Long term – market valuations dictate future forward returns:
As most asset prices steadily rise, it is easy to forget that financial markets are indeed cyclical. Given current fundamental valuation metrics are at historic highs, it is imperative one considers the sequence of events that must occur for the trajectory of higher prices to continue its upward path. Being fully invested at market peaks has its consequences. Granted, the status quo may remain in place for an extended period. Even so, equity investors should consider what transpired with stock prices the last time valuations were similar to today’s elevated levels. As shown in the chart below, from the dot.com market peak of 2000 it took 12 years for the S&P 500 Index to merely regain its prior price level. Technology shares, symbolized by the NASDAQ Index required over 13 years to fully recover. Venture capital investors, represented by the Russell 2000 Technology Index took 16 years for prices to regain their 2000 price range. Waiting over a decade to have one’s capital returned will test the fortitude of any investor.

A few investment comments as we enter 2022:
Despite overwhelming data, during 2021 the broad equity market indices ignored the negative effects that inflation exhibits on capital assets and the value of money. We strongly believe rising costs in virtually every economic component: housing, food, energy, and wages, will be the predominate risk variable market participants cannot disregard much longer.
From the depths of the Great Financial Crisis in March of 2009, the massive scale of liquidity generated by governmental monetary and fiscal stimulus has been the overwhelming driver of rising asset prices. In 2022, not only will government stimulus packages come to an end, but the U.S. Federal Reserve will be forced to institute a series of interest rate hikes to quell inflationary forces.
As interest rates rise, risk management principals will determine the extent portfolios successfully navigate a dramatically changing investment environment. Long duration assets such as high multiple stocks, select real estate sectors, and speculative venture capital projects will most likely experience the initial negative impacts of higher interest rates. For example, last year any investment strategy fully invested in equities generated very attractive returns, especially an equity book levered to the top five technology companies (Microsoft, Apple, Alphabet, Amazon, and Meta Platforms (formerly Facebook)). These five entities now comprise over 25% of the S&P 500’s total market capitalization. Unnoticed by most investors, tech stocks such as these have some of the highest valuation metrics in the marketplace. We believe it highly likely securities with such elevated multiples will be the most susceptible to a price decline as interest rates continue to increase.
Over the last two years these five technology stocks have dominated the S&P 500 Index’s advance, but there were many exceptional companies in the remaining 495 names within the S&P 500 that have not participated in the index’s rise. In fact, more than a handful of companies have either modest or even negative returns over the past two years. We think there are several attractive companies that offer long-term investment opportunities which exhibit high quality financial metrics in sectors such as: infrastructure, media, and telecommunications.
Throughout 2021, we pointed out that virtually every fixed income security would generate a negative total return when measured in real terms. Bond portfolios that have extremely low durations and very high-quality parameters will perform significantly better than fixed income securities that seek yield over capital preservation.
During the high and persistent inflationary scenarios we envision, there are several alternative investments that will perform relatively well in these rising cost environments. Capital assets with pricing power and unique supply-demand characteristics will hold their values over time.
All the best,
John H. Payne, CFA
President/Chief Investment Officer
Arumayta M. Arguello, CFA
Portfolio Manager
Comments are closed.


